Concurrency diagrams
When engineers discuss program design and system architecture, a common source of misunderstanding is concurrency. Often that’s because we make internal assumptions about it, which we presume to be self-evident. But we don’t all make the same assumptions, so you can end up in a situation where multiple conflicting beliefs are held about the concurrency of a system and nobody realises. Left unchecked, these misunderstandings can lurk until much later in the development process, when they’re more expensive to fix. You can prevent these misunderstandings from happening by making concurrency explicit up-front, in a diagram.
Concurrency diagrams are very simple and usually quick to create. They force you to put your assumptions in front of everyone to see, including yourself. Sometimes the act of creating a concurrency diagram can change your own mind about how different parts of a system should be sequenced. All you need are boxes, arrows and text.
Anatomy of a concurrency diagram
A concurrency diagram is a simplified representation of your system, plotted with time as one axis. The other axis separates different functional components; what those are depends on your system and the level of granularity that you’re representing it in. It’s similar to a Gantt chart in many ways, although there are differences.
I like to have time running down the y axis, from top to bottom. This is different to a Gantt chart where time runs from left to right, along the x axis. Plotting time on the y axis instead lets you align concurrent tasks while making more efficient use of vertical space, because every box only consumes one line of text in that dimension. It also feels more intuitive to me, although that may just be familiarity.
The x axis of functional components can get messy if there’s a lot going on, so I like to subdivide it into columns representing layers of architecture. You might have a column for clients, a column for your api, another column for data storage and so on.
After that, all you need are boxes and arrows. Each box represents a thing that happens; it could be a function, an api endpoint, an SQL insert statement or literally anything that can be measured in time. The diagram does not model how long each thing takes, which is another difference to Gantt charts, so all boxes are the same size. Instead it uses the relative position of boxes to identify things that occur concurrently and arrows to identify blocking relationships.
That may all sound quite abstract, so here’s a concrete example for part of a side-project I’ve been working on lately:
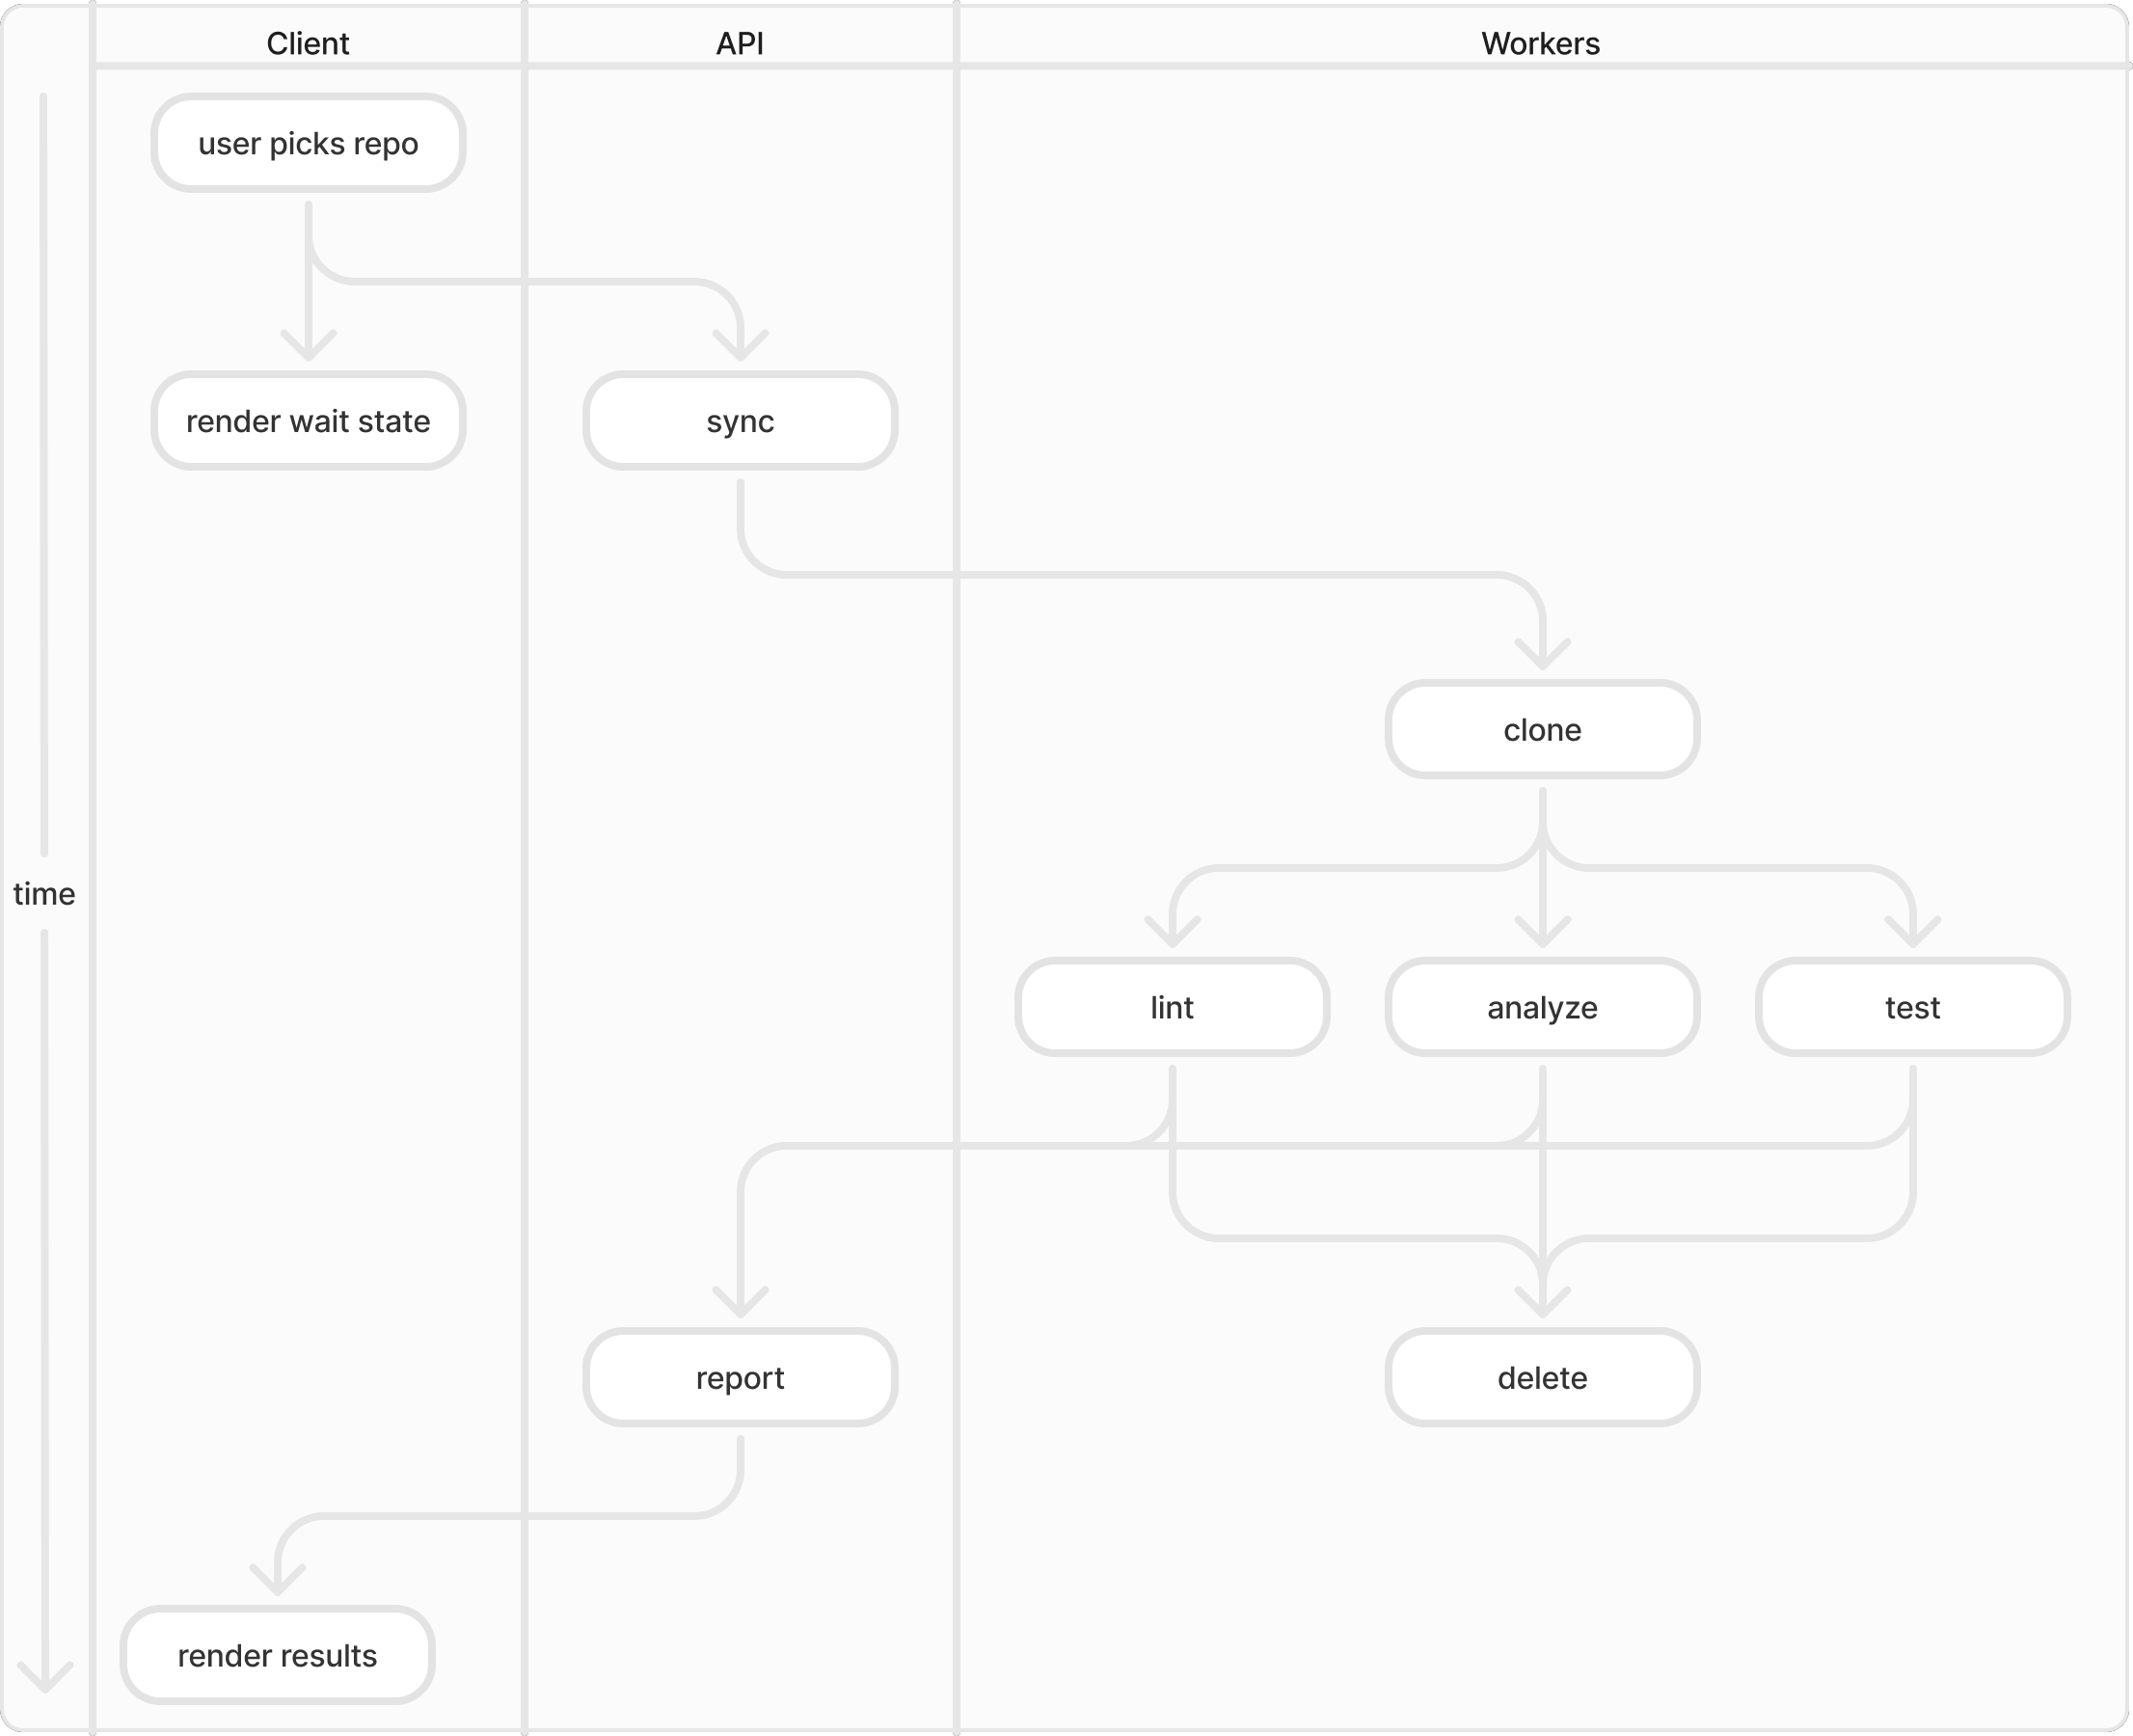
The details aren’t too important here, but notice how concurrent operations are vertically aligned and arrows indicate where blocking occurs. If two people hold different assumptions about which parts of this system should run concurrently, they will be swiftly eliminated by bringing the diagram into discussion.
If your team produces, agrees on, advertises and continues to maintain diagrams like these, it should go a long way to ensuring that everyone pulls in the same direction.